ggplotでの軸ラベル, タイトルの扱い方
Rでggplotを使って作った図の軸ラベルや, タイトルの変更の仕方を解説します.
使用する関数
- labs()
- xlab()
- ylab()
- ggtitle()
使い方
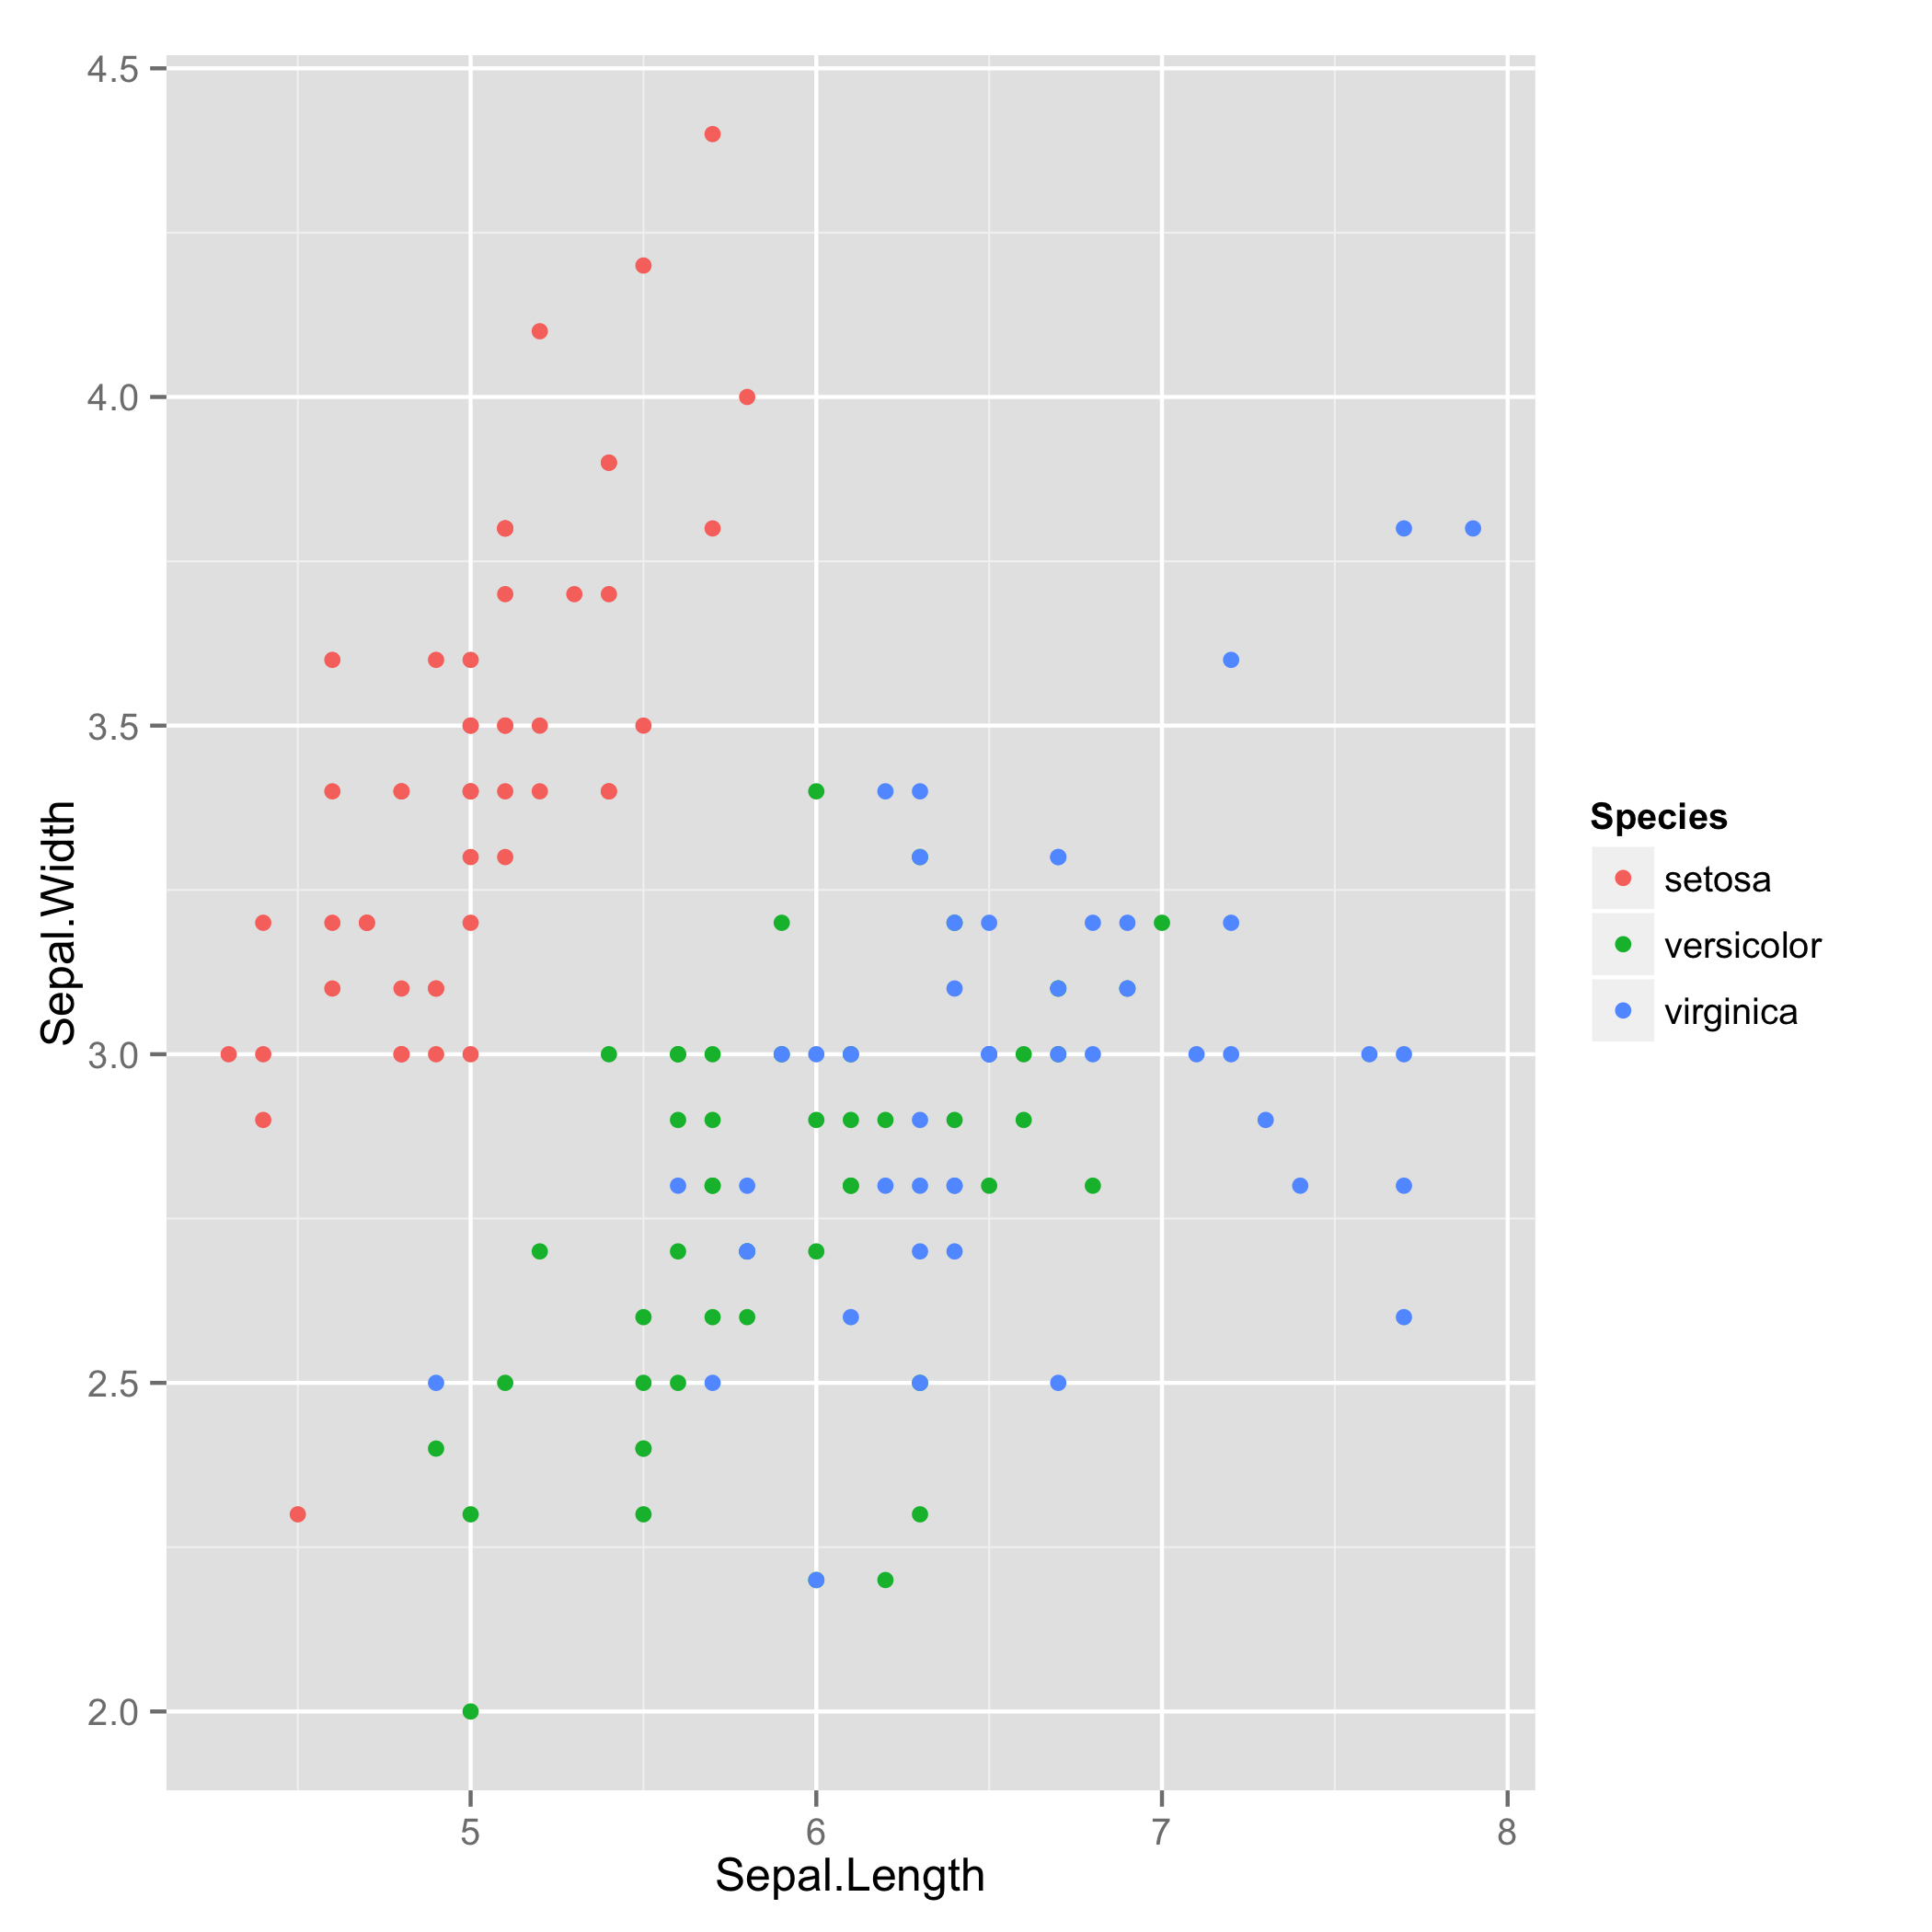
このページでは, 次の図を基本にして, ラベルなどを変えていきます. 使用するデータセットは, irisです.
> library(ggplot2)
> str(iris)
'data.frame':	150 obs. of  5 variables:
 $ Sepal.Length: num  5.1 4.9 4.7 4.6 5 5.4 4.6 5 4.4 4.9 ...
 $ Sepal.Width : num  3.5 3 3.2 3.1 3.6 3.9 3.4 3.4 2.9 3.1 ...
 $ Petal.Length: num  1.4 1.4 1.3 1.5 1.4 1.7 1.4 1.5 1.4 1.5 ...
 $ Petal.Width : num  0.2 0.2 0.2 0.2 0.2 0.4 0.3 0.2 0.2 0.1 ...
 $ Species     : Factor w/ 3 levels "setosa","versicolor",..: 1 1 1 1 1 1 1 1 1 1 ...
> p <- ggplot(iris, aes(x=Sepal.Length, y=Sepal.Width))
> p + geom_point(aes(colour=Species))
> ggsave("labs1.png")
Saving 7 x 7 in image
タイトルを付けたい時は, 以下のようにします.
タイトルをつける
> p + geom_point(aes(colour=Species)) + labs(title="New title")
> ggsave("labs2.png")
Saving 7 x 7 in image

or

> p + geom_point(aes(colour=Species)) + ggtitle("New title")
> ggsave("labs2.png")
Saving 7 x 7 in image

x軸のラベルを変える
x軸のラベルを変更したいときは,
> p + geom_point(aes(colour=Species)) + labs(x="New x-label")
> ggsave("labs3.png")
Saving 7 x 7 in image

or

> p + geom_point(aes(colour=Species)) + xlab("New x-label")
> ggsave("labs3.png")
Saving 7 x 7 in image

y軸のラベルを変える
y軸のラベルを変更したいときは,
> p + geom_point(aes(colour=Species)) + labs(y="New y-label")
> ggsave("labs4.png")
Saving 7 x 7 in image

or

> p + geom_point(aes(colour=Species)) + ylab("New y-label")
> ggsave("labs4.png")
Saving 7 x 7 in image

ガイドのラベルを変える
右側のガイドのラベルを変えたいときは,
> p + geom_point(aes(colour=Species)) + labs(colour="Colour")
> ggsave("labs4.png")
Saving 7 x 7 in image

みたいになります. ここで, 今回はcolourによる分類をしているので, labsでcolourを指定しています. その部分は分類の仕方によって, それぞれ変えます.
全てのラベルを変える
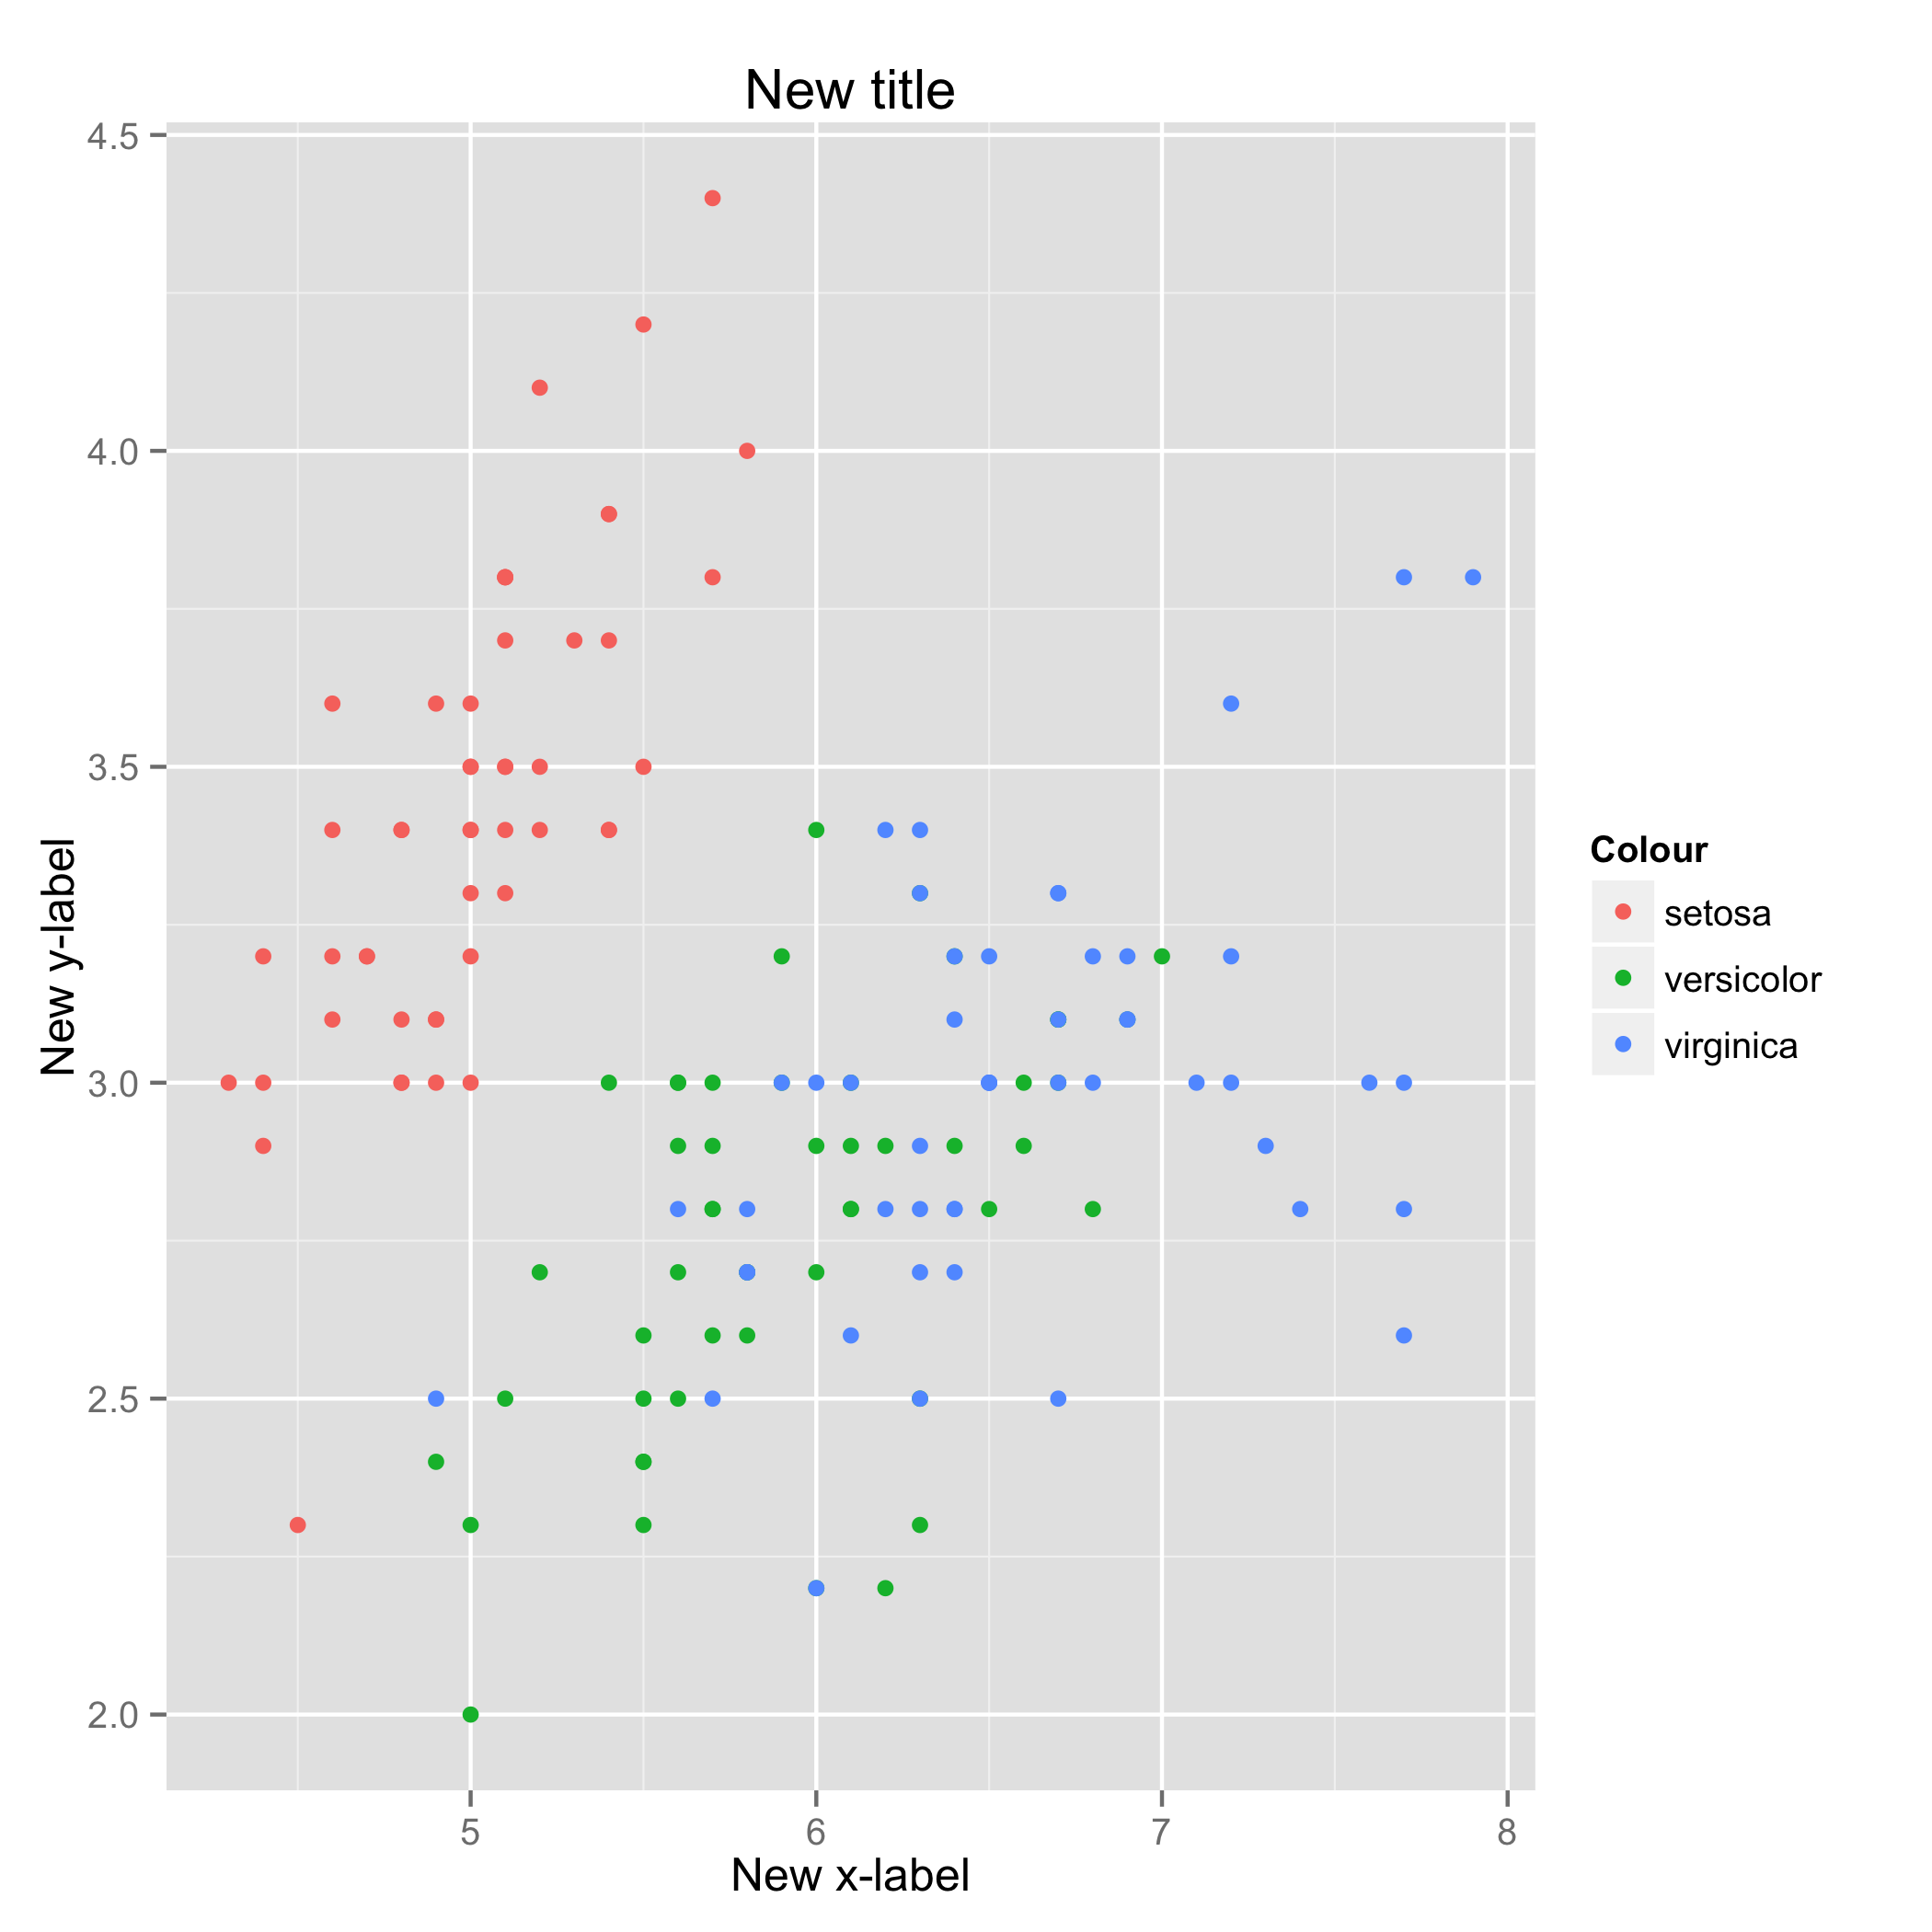
最後に, 全部変えてみます.
> p + geom_point(aes(colour=Species)) + labs(title="New title", x="New x-label", y="New y-label", colour="Colour")
> ggsave("labs6.png")
Saving 7 x 7 in image